How many units go in a case?
How many cases go on a pallet?
How many 12 packs equal $10k?
With many items and many packaging configurations these questions can be very hard to answer. Especially when a new forecast comes out only in revenue totals.
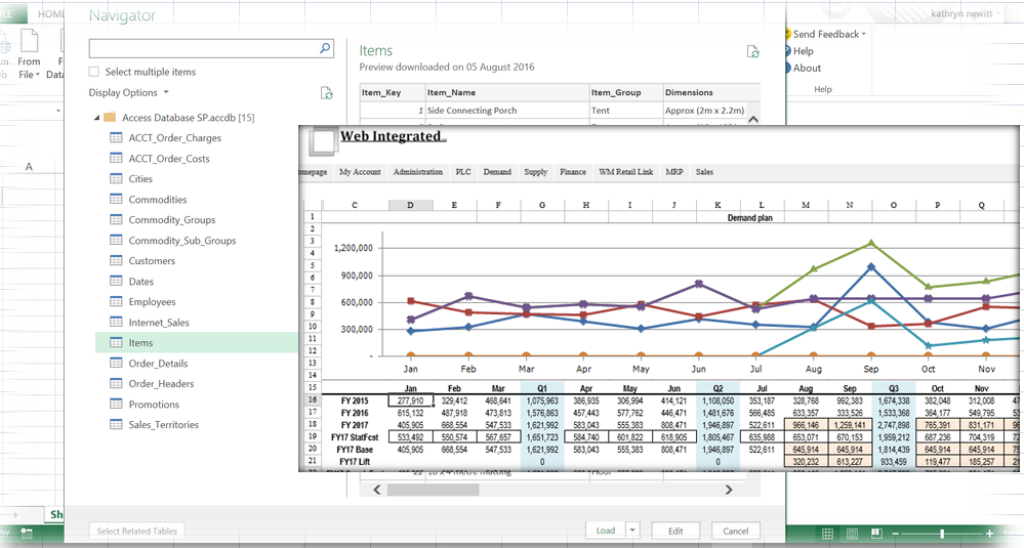
Web-Integrated solution to this problem is to maintain an item map that can translate all the different units of measure into common useful numbers. As aggregate information comes in demand planners can easily translate numbers into useful information.
One real life example and Web-Integrated biggest advantages is calculating revenue from a forecast made up of 1,000 skus. Case to revenue ratio is exact and can be changed in either position.
No more guess work and average prices. Finally the most basic business questions can be answered.
What happens to the budget when distribution is lost or gained?
Who is our most profitable customer and what do they buy the most of?
During business conversations reporting will be able to toggle between multiple measures and interested stakeholders get the information they need.